HNU is also known as the "Horizons BetaPro NYMEX Natural Gas Bull PLUS ETF". This ETF is designed to capture double the daily movements of natural gas. I'm not going to get into the details of how exactly they produce these double leveraged results - there are plenty of articles which describe the method of achieving this double results. What is essential to know here is that the double return is achieved on a DAILY basis, not in the long-term. In the long-term the returns of HNU can vary greatly with what the price of the underlying natural gas is tracing.
Let's look at a recent price of natural gas commodity:

See the pattern? The supports are clearly visible at around the $3.30 area, once at the end of April and once mid-July. Now let's take a look at a chart of HNU:
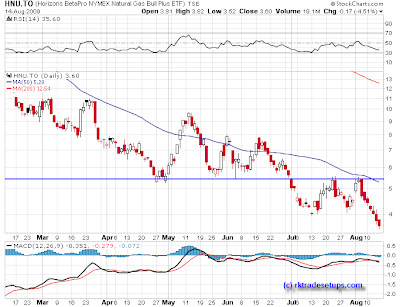
Does this chart look the same? You can clearly see a divergence of price at the end of June where HNU breaks lower at the point where there is support in the underlying commodity.
This ETF has traded much lower than its $5.50 support line, while natural gas is still above its May 2009 support line.
Given all this, how can a swing trader do technical analysis on an ETF where the price is un-correlated to the underlying on a time horizon of more than one day!
Leveraged ETF usually contain the words plus, double, triple, or ultra in the title. Be careful of this kind of leveraged ETFs if you planned timeline for the trade is longer than a day.


