Thursday, August 27, 2009

August 27 - Google Pattern Analysis

The chart below is Google's 2 minute chart for August 27th, with a comparison plot of the S&P500 in blue. Click on the chart for an expanded view.

Google's stock mostly trades in sync with the board market. In today's trading there was a period of time where GOOG diverged from the market to trend lower while the S&P500 traced higher highs. This divergence provided a good opportunity for a high-probability long position.

At around 1:30pm, the divergence was recognized and traders rushed in to close the gap. This can be seen by the rise in volume. In this situation a trader could have gotten long at the time the downtrend line was broken (first arrow) or a more conservative time when the local resistance was broken (second arrow). This would only be a quick-in-quick-out day trade.

For the rest of the day the stock traded in sync with the broad market.

August 27 - GOOG and AAPL Short Position

Following my plan yesterday, I've sold Google and Apple calls to take advantage of an over-bought situation.

Google:
I sold GOOG DEC 2009 calls at a strike of 590 and a premium of $2.50/share. The trade plan is to close out this position at or under $0.50/share at a profit, or close the position at $5/share at a loss if the trade goes against me. I would rather not hold this until expiry as it is over 4 months away.

Apple:
I sold AAPL OCT 2009 calls at a strike of 200 and a premium of $0.40/share. I will place a bracket order to either close the position at $0.05/share or stop-loss at $0.80/share. AAPL has been rising very fast and its almost at its all-time high of $200. Technically speaking I don't think that we should be approaching the all-time high level so early out of the recession. AAPL still depends on consumer spending and with unemployment rates in the US pushing 10% this upshoot maybe premature. So I chose to sell the calls at the strike of 200.

It is very important to place stop-losses for both trades as we are still in an up-market, making this a contrarian trade against the market. Furthermore, I will look to buy these back before their earnings releases as the stock can become very volatile.

Wednesday, August 26, 2009

August 26 - Identifying Market Tipping Points

In the recent market, local trend change points can be seen in the battle field between the bulls and the bears. Each pulls to a different direction until one emerges as the victor. These areas can be spotted by the narrow trading range around certain market levels.

Let's take a look at a daily chart of the S&P500 captured this morning:

I think that with the recent uptrend the markets have moved up too much too fast! We are over due for a correction. Even though I believe that the markets are over-bought, it doesn't mean that the market can't keep going up from here. The quote that "markets can remain irrational far longer than a rational trader can remain liquid," applies very well here!

Looking at the chart, I see a possible trend change pattern forming on the right side. For the past two days the bulls have failed to push the S&P500 past the 1035 level. The past trend change signals have come following the same pattern and the down-tick of the MACD.

I will look for follow through to the downside today or tomorrow to see if a downtrend will begin. Closing below 1020 today on the S&P500 would be a good start.

Following more evidence of a sustainable pullback in the board market, I will look to sell calls on SPY, along with selling GOOG and AAPL which I think are over-bought. Tighter stop-losses are in order as we are in an up-trend.

Thursday, August 20, 2009

August 20 - Real Life Example of Technical Analysis

Yesterday I went to grab a quick lunch with a friend at Brookfield Place food court. As I was deciding what I wanted to eat I saw a place that seemed very new. The decor was very modern, everything seemed new, they even had footage of their appetizing foods and drinks showing on an LCD screen near the menu. This place looked very inviting and stood out from all the other fast food places that seemed old and pale in comparison. The appetizing food on the LCD screen was seductively screaming "Try me!"

Despite the inviting decor, there was something peculiar about this place. Even though the food court was packed and there were long line ups everywhere else this place was surprisingly deserted. At last the curiosity got to me and I had to try the food. Once I bought it back, dug in the first spoonful, and tried a taste I instantly regretted getting it. It was bland and tasteless.

Now you are asking what does all this have to do with trading?!?! Well, I believe this is a perfect example of technical analysis in real life. Technical analysis is all about looking at signs of market sentiment to figure out the status of the underlying. In this example, everything looked great on the surface, but the fact that this place had no customers in a busy food court was an indication of an underlying problem.

Stocks are similar. We may not be sitting in the boardroom of a company to find out if there are any troubles on the horizon, but executives selling stock or a sudden increase in short-interest is an indication of possible underlying problems. As technical analysts, these are only some of the signs we have to watch for in order to make educated predictions on market direction.

Wednesday, August 19, 2009

August 19 - Google Trade (Post Analysis)

Today I bought back the SEPT 500 GOOG calls for $0.50/share as was my original intention when I set up the trade plan. I did not expect the trade to work out so quickly but it has paid off 80% profits in only 5 days!

I was contemplating selling a lower strike price after closing the 500s so I could collect more premium, but I've decided to hold off on that until I have a better indication of the market and where Google might go. In addition, I don't want to trade the same stock consecutively as it is one of my trading rules. I will wait and re-enter if needed. But not today!

Tuesday, August 18, 2009

August 18 - Google follow-up

This post is a follow-up to the August 14 post ("Google Trade Setup"), where I opened a short position in Google Call options at the 500 strike price for $2.50/share premium.

Google stock is greatly effected by market swings. Yesterday's slump in the market brought Google stock down over $15 and broke the local uptrend to the downside. Today's action was an interesting one:


As the broad market climbed to gain back some of yesterday's losses, so Google climbed with it. However, it climbed with less steam than usual. Finally, in early afternoon, Google failed to continue to climb and headed down from there. Even though it closed positive, the price movement was depressed. As the S&P500 gained 1%, Google was barely able to hold a 0.1% increase.

I take this as a sign that bull traders on Google may have run out of steam in the short run and may be looking to take profits. I will look for tomorrow to see follow through.

The GOOG Sept 500 calls traded as low as 0.65/share today. If there is follow through to the down side tomorrow I will buy the 500 calls back at 0.50/share and sell lower strike calls for more premium.

Monday, August 17, 2009

August 17 - Where "PLUS" is actually a MINUS

I've been following natural gas for a while because I believe the commodity is under valued at he current price levels. However, starting to trade HNU on the TSX I soon realize that the using this ETF as a method of trading natural gas can lead to very inconsistent results.


HNU is also known as the "Horizons BetaPro NYMEX Natural Gas Bull PLUS ETF". This ETF is designed to capture double the daily movements of natural gas. I'm not going to get into the details of how exactly they produce these double leveraged results - there are plenty of articles which describe the method of achieving this double results. What is essential to know here is that the double return is achieved on a DAILY basis, not in the long-term. In the long-term the returns of HNU can vary greatly with what the price of the underlying natural gas is tracing.

Let's look at a recent price of natural gas commodity:


See the pattern? The supports are clearly visible at around the $3.30 area, once at the end of April and once mid-July. Now let's take a look at a chart of HNU:


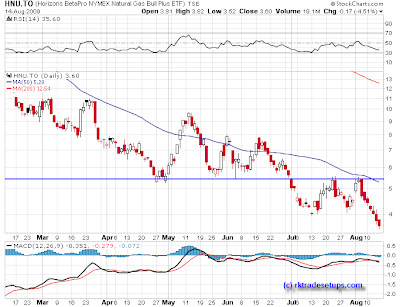
Does this chart look the same? You can clearly see a divergence of price at the end of June where HNU breaks lower at the point where there is support in the underlying commodity.

This ETF has traded much lower than its $5.50 support line, while natural gas is still above its May 2009 support line.

Given all this, how can a swing trader do technical analysis on an ETF where the price is un-correlated to the underlying on a time horizon of more than one day!

Leveraged ETF usually contain the words plus, double, triple, or ultra in the title. Be careful of this kind of leveraged ETFs if you planned timeline for the trade is longer than a day.

Saturday, August 15, 2009

August 15 - The Difference Between Trading and a Full-time Job

In trading, state of mind and how a person looks at trading is very important.

A lot of people who work full-time jobs are constantly bombarded with financial news and trading tips. They open trading accounts and begin to trade. Soon after getting into it, they start to think of trading as a possible road to financial freedom. If only they could replace their income with trading income, then they would be free of the 9-5 grind. Very tempting!!!

In the next step they try to figure out how much they would need to make a week or a month to match their currently salary weekly or monthly income. I've probably done this a thousand times - but every time I need to bring myself back to the reality that: Trading for a living, although very possible, does NOT provide a steady stream of income. You can NOT expect to extract monthly or weekly payments from the market, especially when you start trading.

Trading is unstable! There will be times that you will not see any setups and these are the times when you should stay on the side lines and not trade. There will be no income at these times!
There will also be times when you will have losses. There will be no income at these times either! Finally, you catch a high-probability setup, get in, and it makes you money. At this point a good trader has made enough money to cover the previous losses and some for profits.

So if you've just started trading and feel like you want to replace your salary income with trading income...... STOP!
This is the wrong mind set and it will put unrealistic pressures on your trading, leading to bad trades. If you'd like to make a living as a trader, make sure you have enough money to live off of for at least a year before quitting your job.

Hope this sheds more light on the topic... happy trading!

Friday, August 14, 2009

August 14 - Google Trade Setup

This trade is a bit out of character as far as following usual signals for my trades. But I have been following Google's stock for a while and believe that I'm familiar with its trading patterns. Given that there are no earnings news or other headlines, Google trades with the market - rising in an upmarket and falling in a down day.

Looking at the daily Google chart, it is strong to the upside. BUT I feel that there may be some loss of steam from the bulls. The trading range has narrowed and the climb has slowed.


Volume has declined and the MACD is ticking down while the price diverges to the upside. The markets are over-bought and a pullback is in order. Possibly a retreat to $440 for Google. I want to make use of this but I do not want to stand in front of a charging bull by shorting this stock.

For this purpose I will sell $500 calls for September on Google. I have sold numerous calls at the strike price of $500/share for September expiry for a premium of $2.50/share.

I do not plan to hold these options until expiry, I will buy them back at around 80% profit - at around $0.50/share.

I do have a spot-loss set up for this, in case the trade goes against me. If the premium doubles to $5 I will buy them back at a loss.... Let's see how the markets act in the coming weeks.