Thursday, December 17, 2009

December 17 - Counter Trend Trading (GLD)

In today's post I will show a high probability counter-trend trading strategy that I often use with a great success rate. This is what technical trading is all about; to recognize patterns which have in the past yielded a certain outcome and are "highly-probable" to yield the same result again. Of course there is never a guarantee that the pattern will play-out the exactly the same and that's why stop measures are taken to reduce downside exposure in case the trade doesn't work out.

Below is a daily chart of GLD which is the StreetTRACKS ETF for Gold:


Now this is obviously an after-the-fact plot which demonstrates the result as it has played out. The pattern before the breakdown around the 7th is that of a steady uptrend following an uptrend channel. Then the price runs away from the trend and starts a sort-of a "panic" buying frenzy where the new trendline has a sharp slope to the upside. These buying frenzies are often unsustainable, especially in heavily traded larger stocks/ETFs.

Near the end of the sharp uptrend the RSI shows an over-bought situation. On the day of the break the volume shoots higher than the average volume as traders sell out of this ETF and create further downward pressure. At the point of a confirmed break a short position should be initiated with a stop to the upside either in the form of a stop-loss or buying calls in the ETF.

Since the break the stock has declined a good 7% while consolidating near the "pre-frenzy" trendline and at the right side of the chart it looks to be bouncing back from the steady uptrend line.

For my trading this has been one of the most effective and profitable.

Wednesday, December 16, 2009

December 16 - GOOG and AAPL

Google:
I am still watching Google for signs of weakness as it has run up very quickly in the past couple of weeks and is now trading in a narrow range, where the bulls are being kept at bay at around $600. I will be looking at selling March 700 CALLS which are today trading around $4.20/share. I will look to slowly initiate a short position as signs of a downturn begin to show.

Apple:
This stock's explosive rally has come to a halt and it is now trading tightly around the $195 - $210 range. I'm bearish on this stock and looking to initiate a short position. I think the calls are trading cheap so instead of selling calls I am considering shorting the stock and buying Jan 205 or 210 calls as a hedge incase we start 2010 with a rally.

Friday, December 4, 2009

December 4 - AAPL Short

Following my last posted article on Google, another one of my favourite trades is currently AAPL. The current setup is a perfect resistance and trend break scenario.

The recent trend upwards has now come to a halt as the stock found a local ceiling around the 210 price point. This is not surprising as I think AAPL's price has risen too far and too fast - not to mention surpassing its pre-recession highs.

Below is a daily price plot of AAPL with my drawn trend lines:


As AAPL breaks the uptrend and starts to move down, I would look to straight out short this stock. Unfortunately I will not take a short position today as I will be on vacation next week and unable to monitor it. So I will be selling out-of-the-money calls for Jan 2010.

Tuesday, December 1, 2009

November 27 - Google Trade Watch

One of my favourite stocks for short-term trades has to be Google. Over the past couple of months this stock has had an amazing run up following the market's rally. However, in the recent months it has run away from the market and has started a steeper upward slope. The plot below shows a weekly chart of GOOG with my technical annotations and trend lines.

My counter-trend analysis tells me to watch for a possible break of the recent buying frenzy. Technical signs point to a possible slow down of buyers as volume has steadily declined over the past two months. The RSI is in over-bought position above the 70 line. The MACD is keeping steady and not providing any signals yet, but I would watch for a cross of the faster line over the slower (black line over red).

The daily chart below, shows a more granular detail and possible signals to initiate a short.


I will look to either initiate a short position in the stock or sell near-the-money calls on Google as the trend breaks.

Wednesday, November 25, 2009

November 25 - Market Commentary

The bear in me is still not dead and it surfaces to when I look past the media information and concentrate on what the chart is telling me. Everyone seems to be overwhelmed with massive amounts of data: the fluctuating unemployment rate, retails sales, home sales, mortgage and credit card delinquencies, etc. So far this has all lead to rallies in the market, but where is it going.

I am in the camp that says the bulls are losing steam in the short-run. Looking at the daily chart of the S&P500 below, the technicals point to a local weakness in the bulls. The tops are getting closer together as it becomes harder to push to new levels. Volume, MACD, and RSI indicators are all in downtrends.


As many who have been following my blog know, for some time I have been selling far-out-of-the-money calls to capture the slow down and possible downturn of the market. Looking at the technicals, I think that the time for a halt of rally has come. Will we have a traditional "Santa Clause" rally at the end of the year or will we see profit taking which will slow down or even end the rally.

Friday, November 20, 2009

November 19 - Tricks of the Trade!

Not Doing Anything is Hardest to Do

When it comes to trading there is a common misconception that traders are always buying and selling. This could not be farther from the truth. Two of the main attributes of a successful trader are patience and restraint.

Sometimes we need to sit on our hands and do nothing while the markets reveal their direction. It becomes very easy to get caught in the rapid ups and downs and forget what's really happening. If you feel like you're putting in trades or closing trades simply for the excitement of a new position or closing of a profitable position you may be crossing the line from a calculated trader to gambler. All trades need to be according to plan!

Sometimes your analysis tells you to that a change may be coming or that there may be upcoming underlying complications. In these times all you have to do is WAIT for confirmation which can sometimes be a drawn out process. Many amateur traders will feel the need to trade right away. Hold on and wait while the trend you predicted develops and is confirmed before jumping in for the sake of trading.

These days I find myself putting in smaller trades as I re-assess the state of the markets... Will it go higher? Will there be a major correction? or are we going sideways! The broader markets seem to be flatting out and conflicting data are starting to have their effects on market psychology.

Wednesday, October 28, 2009

October 28 - Market Commentary

Today was definitely and interesting day. Finally after an explosive rally fueled by better than expected bank earnings and other economic data, we have come to another pullback. But what now???

Like the pull back in early October will this be followed by another raging rally? or is this the down turn some have been waiting for?


Today we broke the 50 day simple moving average to the down side and closed below it, ending the day down almost 2%. So far the rally has had all the technical indicators on its side, but I believe a breach of support will bring a lot of technical traders to the realization that this market is over-bought and in that sense a pullback to lower levels will become a self-fulfilling prophecy.

I will look for follow through tomorrow. The bottom on these pullbacks has always contained a day of short trading ranges, followed by the upswing thereafter (reference above chart).

October 28 - Algo Trading

Recently I've noticed that no matter how much I follow a trading plan or set stops that there is always some emotions involved in trading. If someone is a strong believer that a stock should be going up or down for some reason, they will eventually see it in the technicals and be convinced that this is the way the direction should be. The way we trade is constantly influenced by external inputs of data. The human mind is easily influenced by news or other convincing sources of information.

To eliminate emotions from the equation we must eliminate the human from the decision making part of the equation. A machine is completely impartial and uninfluenced by emotional impulse in decision making - not to mention faster than a human in executing a planned trade.

So I have started to brush up on my Java in order to interface with Interactive Brokers' API for trading platform. There are some strategies which I will look to employ on the paper trading account after much back testing. I will publish some of the strategies as I go along.

As a side note, it is interesting to note that most of the traded volume on exchanges are executed by computers as part of algorithmic trading platforms. The NYSE releases weekly program trading statistics, and for the week of October 12-16, program trading accounted for approximately 29% of the average daily 2.5 billion shares traded. (http://www.nyse.com/press/1256207611289.html)

Tuesday, October 27, 2009

October 26 - What everyone expects will NOT happen!

Well it's been a while since I've posted to the blog and the main reason is that I'm waiting for some certainty to the markets..... Everyone seems to be sold on the fact that the recession is over and we're on our way back to the top... Well I am NOT one of those people.

I believe that we are over-bought at these levels of the market. Stocks such as AAPL have surpassed their all-time, pre-recession highs and this does not intuitively make sense to me - the rise has been too far and too fast.

Even though news is not a technical indicator I believe that the way that the media reports the news is. During the downturn all reported and emphasised news were bad and the market reacted by over-selling. Near the bottom and on the way up, the reported news was a mix of good and bad. The rally was further sustained by continued reporting of unexpected rise in house prices, surprise declines in unemployment rate, and upbeat earnings. Now we are again seeing a mix of good and bad news. It is interesting that data such as lower unemployment rate is not having as much of a rallying effect on the market anymore.

I am selling far out of the money calls on the broad market and stocks such as GOOG, AAPL, MA, and other which I think are over-bought.

Wednesday, October 14, 2009

October 14 - AAPL and GOOG post trade

Today I bought back the OCT 200 AAPL calls at $0.05/share making the trade a success. I still think AAPL is over-bought, but will not short again until there is confirmation of a downturn. In the meanwhile, it seems too strong.

As for GOOG, apparently people think its a good buy at these ranges and continue to pump up the price. Even though I think they too are over-bought at these levels, I closed out the trade at a loss. I bought the DEC 590 calls back for $5.60/share. I would love to see them disappoint tomorrow, but for now I had to reduce my exposure to make sure I don't get caught offside incase they top expectations and the market gets itself into a buying frenzy.

Thursday, October 8, 2009

October 8 - AAPL and GOOG updates

I feel that an update on the AAPL and GOOG positions are in order given the recent movements in the market and that we're approaching their earnings dates.

AAPL:
This trade was initiated on August 27th when OCT 200 AAPL calls were sold for $0.80/share. Although the underlying stock has moved higher since the selling date, the calls are trading just below the $0.80 mark as time value has decayed and lowered the premium. Normally I would not hold this call when the stock is soaring and we are days away from earnings. However, these calls will expire on Friday October 16th, while the earnings is reported on Monday October 19th. This way I am avoiding the volatility that can result from the earnings after the announcement. I don't see AAPL trading above $200/share until next Friday but I will watch it closely just incase I need to close it out before expiry.


GOOG:
This trade was initiated on August 27th when DEC 590 calls were sold for an average of $2.50/share. This stock was fine until the past 2 days where it has climbed from nearly $490 to around $520.

The trade plan calls for a stop-loss limit of $5, which is why I am thinking about closing out this trade, especially as the earnings call is scheduled for next Thursday October 15th. A good report can send this stock soaring. I do not want to take that risk, especially as these calls are long dated - all the way to December 18th. I will look to the next trading days to see if I will close it out or hold on to it.

Wednesday, October 7, 2009

October 7 - Market Commentary

I've been watching the markets the past week and trying to figure out at which level the pull back will be exhasted and the rally will resume. It seems that we've bounced off the 50-day moving average quite nicely. However, on a technical basis I don't think we're out of the woods. The S&P500 made a top near the 23rd of October and since then we've made a lower top on the 29th. This bounce from the 50-day moving average has yet to strongly break above the 1065 level before we go back to rally mode.

If we fail to break the previous high and stay above it, we may see a move down from there!
I will look to the next couple of days to see how the market trades.

Thursday, September 24, 2009

September 24 - LULU Post Trade Analysis

Well that was a fast trade!!!! LULU trade reached its planned goal of about $1 downside within 3 days. This is following the Trade Watch setup on September 14, which put LULU on my radar for a possible short position. In the September 22 post, I mentioned that the trade had been taken at $24.40 with a stop-loss at $25.22.

Today the trade was fully closed out today at $23.05 leading to a $1.35 profit / share.


The move down was also aided by the fact that the markets have been over-bought for days and needed to pull back. The S&P500 closed at 1050 today, down 1% from yesterday and down about 2% since the short position on LULU was initiated.

Although the trade closed at $23.05, LULU continued the decline to end the day at $22.57. It is possible that the stock will trade lower tomorrow as today's action was weak and bearish. However, the trade was executed within the planned range. There should be no regrets even if it moves lower tomorrow.

Wednesday, September 23, 2009

September 23 - Tricks of the Trade - Part 3

Triangle Breakouts

One strategy is to trade triangle breakouts to the direction of the breakout.
Sometimes a stock which trades on a wide range gets squeezed from top and bottom in a triangular envelope and trades at tight range. Let's look at a historical chart of Mastercard which shows a triangle formation breakout on July 15, 2009:

Now lets fast forward to today and see what would have resulted from going long on the upside breakout of Mastercard from the triangle formation.


A word of caution at this point is that not all of the breakouts lead to such an upside. This was obviously assisted by the rally in the equity markets resulting from hopes of recovery and cheap capital. Sometimes after a breakout, there is downside follow through and the stock whipsaws between breakouts to the upside and downside. In these situations where follow through is weak or indecisive, its is best to put a tight stop-loss and look for other opportunities.

Tuesday, September 22, 2009

September 22 - LULU Trade

Following my trade watch for Lululemon (LULU), my short-sell trade was taken today at $24.40/share.


I've put a stop-loss order at $25.22 to fully exit the position. My expectation for a downside is a minimum of $1/share profit, however, depending on market strength I will look to revise this target. If the market continues to go strong, even though I believe it's over-bought, I will try to take earlier profits. If the market shows some weakness, I will hold on for more downside profits.

Tuesday, September 15, 2009

September 14 - Lululemon (LULU) Trade Watch

Before starting this post, I should mention that Lululemon is traded both on the TSX and NASDAQ, under the tickers LLL and LULU respectively. Although in this post I chart and analyze LULU, it can be extended to the ticker traded on TSX.

With the recent earnings news released on September 10th, the stock has had a great run up. However, I'm starting to see a pattern I'm very familiar with - the unsustainable sharp run-up. The result of these patterns is an eventual pull back and I will look to put in a trade to capture the downside. Let's look at a daily one-year chart of LULU:


This pattern has repeated twice in the past couple of months, and possibly setting up for a third time! The pullbacks are very shallow followed by strong up movements, which means if I want to play contrarian, I will have to be in and out fast. As an addition to the volume, the 20 day Average True Range (ATR) has been plotted at the bottom. So at a $1 ATR, I can expect this stock to swing about an average of $1 a day. This way I can get a feel for how far to put stop-losses.

Lets look closer for signs of near-term strength or weakness. Below is today's chart in 5 minute intervals:


Today, LULU climbed with the markets but met with resistance in the afternoon as a triple top formed at around $24. This is bearish in the short-term and I expected a slide from there, however, it finished strong at the day's high. I will look to tomorrow's trading day for a short position entry... especially if we gap up, see market weakness, and come back below resistance levels.

Friday, September 11, 2009

September 11 - Update on GOOG and AAPL trades

Since the initiation of both short positions, the stocks experienced a pull back and continued towards their previous high. However, the Call options that were sold on August 27th have lost more value and indicate a profit.

GOOG DEC 590 calls currently trade at $1.35/share and the AAPL OCT 200 calls trade at $0.40/share. They have both essentially halved in value since as the both stocks have lost quite a bit of steam to the upside.

I am on trade and do not want to keep these positions around earnings as volatility could introduce large moves. Depending on what happens between now and late October when they report, I will look to close out these positions. Right now I have them on close watch.

Thursday, August 27, 2009

August 27 - Google Pattern Analysis

The chart below is Google's 2 minute chart for August 27th, with a comparison plot of the S&P500 in blue. Click on the chart for an expanded view.

Google's stock mostly trades in sync with the board market. In today's trading there was a period of time where GOOG diverged from the market to trend lower while the S&P500 traced higher highs. This divergence provided a good opportunity for a high-probability long position.

At around 1:30pm, the divergence was recognized and traders rushed in to close the gap. This can be seen by the rise in volume. In this situation a trader could have gotten long at the time the downtrend line was broken (first arrow) or a more conservative time when the local resistance was broken (second arrow). This would only be a quick-in-quick-out day trade.

For the rest of the day the stock traded in sync with the broad market.

August 27 - GOOG and AAPL Short Position

Following my plan yesterday, I've sold Google and Apple calls to take advantage of an over-bought situation.

Google:
I sold GOOG DEC 2009 calls at a strike of 590 and a premium of $2.50/share. The trade plan is to close out this position at or under $0.50/share at a profit, or close the position at $5/share at a loss if the trade goes against me. I would rather not hold this until expiry as it is over 4 months away.

Apple:
I sold AAPL OCT 2009 calls at a strike of 200 and a premium of $0.40/share. I will place a bracket order to either close the position at $0.05/share or stop-loss at $0.80/share. AAPL has been rising very fast and its almost at its all-time high of $200. Technically speaking I don't think that we should be approaching the all-time high level so early out of the recession. AAPL still depends on consumer spending and with unemployment rates in the US pushing 10% this upshoot maybe premature. So I chose to sell the calls at the strike of 200.

It is very important to place stop-losses for both trades as we are still in an up-market, making this a contrarian trade against the market. Furthermore, I will look to buy these back before their earnings releases as the stock can become very volatile.

Wednesday, August 26, 2009

August 26 - Identifying Market Tipping Points

In the recent market, local trend change points can be seen in the battle field between the bulls and the bears. Each pulls to a different direction until one emerges as the victor. These areas can be spotted by the narrow trading range around certain market levels.

Let's take a look at a daily chart of the S&P500 captured this morning:

I think that with the recent uptrend the markets have moved up too much too fast! We are over due for a correction. Even though I believe that the markets are over-bought, it doesn't mean that the market can't keep going up from here. The quote that "markets can remain irrational far longer than a rational trader can remain liquid," applies very well here!

Looking at the chart, I see a possible trend change pattern forming on the right side. For the past two days the bulls have failed to push the S&P500 past the 1035 level. The past trend change signals have come following the same pattern and the down-tick of the MACD.

I will look for follow through to the downside today or tomorrow to see if a downtrend will begin. Closing below 1020 today on the S&P500 would be a good start.

Following more evidence of a sustainable pullback in the board market, I will look to sell calls on SPY, along with selling GOOG and AAPL which I think are over-bought. Tighter stop-losses are in order as we are in an up-trend.

Thursday, August 20, 2009

August 20 - Real Life Example of Technical Analysis

Yesterday I went to grab a quick lunch with a friend at Brookfield Place food court. As I was deciding what I wanted to eat I saw a place that seemed very new. The decor was very modern, everything seemed new, they even had footage of their appetizing foods and drinks showing on an LCD screen near the menu. This place looked very inviting and stood out from all the other fast food places that seemed old and pale in comparison. The appetizing food on the LCD screen was seductively screaming "Try me!"

Despite the inviting decor, there was something peculiar about this place. Even though the food court was packed and there were long line ups everywhere else this place was surprisingly deserted. At last the curiosity got to me and I had to try the food. Once I bought it back, dug in the first spoonful, and tried a taste I instantly regretted getting it. It was bland and tasteless.

Now you are asking what does all this have to do with trading?!?! Well, I believe this is a perfect example of technical analysis in real life. Technical analysis is all about looking at signs of market sentiment to figure out the status of the underlying. In this example, everything looked great on the surface, but the fact that this place had no customers in a busy food court was an indication of an underlying problem.

Stocks are similar. We may not be sitting in the boardroom of a company to find out if there are any troubles on the horizon, but executives selling stock or a sudden increase in short-interest is an indication of possible underlying problems. As technical analysts, these are only some of the signs we have to watch for in order to make educated predictions on market direction.

Wednesday, August 19, 2009

August 19 - Google Trade (Post Analysis)

Today I bought back the SEPT 500 GOOG calls for $0.50/share as was my original intention when I set up the trade plan. I did not expect the trade to work out so quickly but it has paid off 80% profits in only 5 days!

I was contemplating selling a lower strike price after closing the 500s so I could collect more premium, but I've decided to hold off on that until I have a better indication of the market and where Google might go. In addition, I don't want to trade the same stock consecutively as it is one of my trading rules. I will wait and re-enter if needed. But not today!

Tuesday, August 18, 2009

August 18 - Google follow-up

This post is a follow-up to the August 14 post ("Google Trade Setup"), where I opened a short position in Google Call options at the 500 strike price for $2.50/share premium.

Google stock is greatly effected by market swings. Yesterday's slump in the market brought Google stock down over $15 and broke the local uptrend to the downside. Today's action was an interesting one:


As the broad market climbed to gain back some of yesterday's losses, so Google climbed with it. However, it climbed with less steam than usual. Finally, in early afternoon, Google failed to continue to climb and headed down from there. Even though it closed positive, the price movement was depressed. As the S&P500 gained 1%, Google was barely able to hold a 0.1% increase.

I take this as a sign that bull traders on Google may have run out of steam in the short run and may be looking to take profits. I will look for tomorrow to see follow through.

The GOOG Sept 500 calls traded as low as 0.65/share today. If there is follow through to the down side tomorrow I will buy the 500 calls back at 0.50/share and sell lower strike calls for more premium.

Monday, August 17, 2009

August 17 - Where "PLUS" is actually a MINUS

I've been following natural gas for a while because I believe the commodity is under valued at he current price levels. However, starting to trade HNU on the TSX I soon realize that the using this ETF as a method of trading natural gas can lead to very inconsistent results.


HNU is also known as the "Horizons BetaPro NYMEX Natural Gas Bull PLUS ETF". This ETF is designed to capture double the daily movements of natural gas. I'm not going to get into the details of how exactly they produce these double leveraged results - there are plenty of articles which describe the method of achieving this double results. What is essential to know here is that the double return is achieved on a DAILY basis, not in the long-term. In the long-term the returns of HNU can vary greatly with what the price of the underlying natural gas is tracing.

Let's look at a recent price of natural gas commodity:


See the pattern? The supports are clearly visible at around the $3.30 area, once at the end of April and once mid-July. Now let's take a look at a chart of HNU:


Does this chart look the same? You can clearly see a divergence of price at the end of June where HNU breaks lower at the point where there is support in the underlying commodity.

This ETF has traded much lower than its $5.50 support line, while natural gas is still above its May 2009 support line.

Given all this, how can a swing trader do technical analysis on an ETF where the price is un-correlated to the underlying on a time horizon of more than one day!

Leveraged ETF usually contain the words plus, double, triple, or ultra in the title. Be careful of this kind of leveraged ETFs if you planned timeline for the trade is longer than a day.

Saturday, August 15, 2009

August 15 - The Difference Between Trading and a Full-time Job

In trading, state of mind and how a person looks at trading is very important.

A lot of people who work full-time jobs are constantly bombarded with financial news and trading tips. They open trading accounts and begin to trade. Soon after getting into it, they start to think of trading as a possible road to financial freedom. If only they could replace their income with trading income, then they would be free of the 9-5 grind. Very tempting!!!

In the next step they try to figure out how much they would need to make a week or a month to match their currently salary weekly or monthly income. I've probably done this a thousand times - but every time I need to bring myself back to the reality that: Trading for a living, although very possible, does NOT provide a steady stream of income. You can NOT expect to extract monthly or weekly payments from the market, especially when you start trading.

Trading is unstable! There will be times that you will not see any setups and these are the times when you should stay on the side lines and not trade. There will be no income at these times!
There will also be times when you will have losses. There will be no income at these times either! Finally, you catch a high-probability setup, get in, and it makes you money. At this point a good trader has made enough money to cover the previous losses and some for profits.

So if you've just started trading and feel like you want to replace your salary income with trading income...... STOP!
This is the wrong mind set and it will put unrealistic pressures on your trading, leading to bad trades. If you'd like to make a living as a trader, make sure you have enough money to live off of for at least a year before quitting your job.

Hope this sheds more light on the topic... happy trading!

Friday, August 14, 2009

August 14 - Google Trade Setup

This trade is a bit out of character as far as following usual signals for my trades. But I have been following Google's stock for a while and believe that I'm familiar with its trading patterns. Given that there are no earnings news or other headlines, Google trades with the market - rising in an upmarket and falling in a down day.

Looking at the daily Google chart, it is strong to the upside. BUT I feel that there may be some loss of steam from the bulls. The trading range has narrowed and the climb has slowed.


Volume has declined and the MACD is ticking down while the price diverges to the upside. The markets are over-bought and a pullback is in order. Possibly a retreat to $440 for Google. I want to make use of this but I do not want to stand in front of a charging bull by shorting this stock.

For this purpose I will sell $500 calls for September on Google. I have sold numerous calls at the strike price of $500/share for September expiry for a premium of $2.50/share.

I do not plan to hold these options until expiry, I will buy them back at around 80% profit - at around $0.50/share.

I do have a spot-loss set up for this, in case the trade goes against me. If the premium doubles to $5 I will buy them back at a loss.... Let's see how the markets act in the coming weeks.

Friday, July 31, 2009

July 31 - SP500 Commentary

I haven't posted in a while as I've been away on vacation. I'm glad I was on the sidelines as the position I had in mind would have been short the S&P.

However, the S&P has soared in the past weeks to 2009 all time highs as the market has been excited by good news and brushed bad news aside. Market sentiment now is that a bottom has been set and many are convinced (not without merit) that downside risk from here is known and measurable. So with optimism people have been coming in on dips in the market and these people will hold their positions through a downturn as their entry prices are low.

Let's take a look at the S&P500 with support lines:


The support lines at 875 have been very strong, and the 950 resistance proved to be minor in the recent rally. For my position, I would not get in at this point as I don't want to chase the market in a rally. I would look for a retest of the 950 level to see where it can go. I will look to get in if support is strong at that level.

I also post a chart of the S&P500 with Bollinger Band channels to show that even with the recent rally, we are within the volatility channels and there could still be upside from here.


I will look to post more commentaries in the coming week...

Monday, July 20, 2009

July 20 - SP update

Over the past week we've seen a sharp rebound off the 875 support level on average volume. Currently we're trading in a tight range between the 875 support and 950 resistance.

The market had been waiting to see what happens to CIT and this morning the news came out that CIT will be rescued. The S&P500 is already up in pre-market trading, but let's see how the day goes....


Volume is average, I would have expected an increase in volume. MACD is bullish as the moving averages have crossed to the upside. More will be revealed during the week.

Friday, July 17, 2009

July 17, 2009 - GOOG Put Spread (Post Analysis)

This entry serves as the after-game analysis of the trade I put in on July 3rd on a Google Put Spread strategy.

In after hours yesterday Google came out with their Q2 earnings results, reporting 3% revenue increases from the same quarter last year. The news wasn't taken well by the street and the stock closed about 3% lower at $430.25 which is way above the threshold for our options. As of today's close, our short positions in the 350s expires unexercised and we keep the income of $300 / base contract. Similarly our long position in the 360s expires worthless and we lose $175 for a net of $125 per base contract.

Note that the example is in base contracts. To increase profits (and also exposure), you increase the number of contracts, but it is very important to keep the 1:3 ratio of long to short for an effective spread.


I've gotten a lot of questions about why I would buy the 360 puts, while selling the 350s and not just sell the 350s if I thought Google would stay above 350. It is true that selling only the 350s alone would create more profits, but it would also create more risk. With giving up some of the profits upfront you can hedge your position in two ways:

1. Price:
If the earnings report was horrible and the stock tanked you would still be protected until the breakeven point at around $345. And even below that your losses would be partially offeset by the gain in the 360 puts you were holding.

2. Volatility:
Volatility can increase option pricing drastically. If the stock fluctuates with wild swings volatility will increase and so will the price of your options. If the volatility is accompanied by a drop in price then the put values may increase drastically. Just to give a sense of the change, if the price drops to $370 in a volatile market, your short options (which were sold for $1/share) can increase to $10/share. This creates a temporary loss 10 times your original premium. If you have sold a lot of contracts this can cause a large loss to your portfolio and increase your margin requirements (you need more money in your account to hold this position until expiry).

However, with your hedge in place, the increase in the price of the 360 put will offset some of the losses and take wild swings in profit and loss out of your portfolio.

Hedge funds are actually measured based on how volatile their portfolio is compared to market volatility.... does it swing wildly? or is it stable!

Stability and protection is worth giving up some profits.... especially in this market.

July 17, 2009 - Trading Essentials - part 2

Don't Overtrade

Overtrading is another important pitfall to avoid. Successful traders aren't constantly getting in and out of positions or putting on positions solely for the purpose of being in the market.

For new traders, trading is exciting and being in the market offers an excitement not unlike the action in casinos. And this is just another reason why the line between trading and gambling can get blurred for new traders. It is important to not trade for the excitement but only if a high probabilty opportunity is available.

Sometimes when the trading platform is open in front of you, the temptation to put on a trader or end a trade starts to build. It may even compel you to change your strategy mid-game or start moving your stops in order to "better" your trade. As I've suggested before, the best way to avoid trading with emotions is to stay out of any situation that may cause those emotions.

For this I would suggest not having your trading platform open all the time. Once you have put on your trades, close the application and monitor your trades via other reporting methods. I use Yahoo Finance. For approximately $100 / year you can get realtime data streamed through Yahoo Finance, which otherwise has a 20 minute delay. This allows me to monitor positions and pricing without being in a situation where I can jump in and out of trades on a whim.

Constantly having your platform open can cause you to overtrade. Besides putting you in an emtional situation, overtrading can rack up commissions for the broker, which may not seem much at first, but they quickly add up...... Trust me!

Happy trading...

Tuesday, July 14, 2009

July 14, 2009 - Trading Essentials - part 1

The markets have been choppy in the past week and trends are very short lived.
For a while I've wanted to post on some trading essentials for new traders as many of my recently graduated friends are just getting into trading and have opened online trading accounts. One important thing about trading is:

Don't trade an under capitalized account
One of the mistakes almost everyone makes starting out is to put a couple of thousand dollars they have saved up into a trading account in hopes of making stellar returns. Or even worse, they blur the lines between trading and investing for the long term.

It's very hard to trade with even as much as ten thousand dollars. First off you cannot buy too many shares of certain stocks. Secondly, and possibly most importantly, there isn't much room for losses.

It's a common misconception that all of a successful trader's positions should make money. In fact, this is farthest from the truth. Even a trader with a 50% error rate can make money. The hidden key to success is control, position sizing, and the ability to see a trade that is not working and cut losses and let winning trades work.

Now knowing that there will be losses along the way, your account has to be able to handle those losses and have enough capital left over to trade another day. To go further, your account would have to be able to weather a string of losses and still allow you to go on trading.

Even though I hate making a casino reference in a trading post, I think the following example is the best way to show how an undercapitalized account can be disastrous to a trader.
I've seen too many people at $25-minimum blackjack tables who come in with $100 or even $50 in hopes of making money. Almost all of these people soon find themselves bankrupt when a string of losses hits - and let's be realistic those strings will happen at some point. Then there is no more capital to go on. They cannot weather the storm long enough to bounce back. These players leave the table, having lost 100% of their capital and vow never to touch blackjack again because they "don't understand it."

The same mistake can be made with trading accounts. It is important to make sure to have enough capital to go on trading if the market turns against you and deals you a string of losses.

I've heard professionals say that realistically you need as much as a million dollars to start trading a personal account! To me that's not very feasible at this point. How much you want to fund your account is up to you, but my advice to all newer traders is: Do not trade an undercapitalized account. Keep money in a principal-protected security and trade a paper account to learn the tricks before putting your money to work.

Happy trading...

Monday, July 13, 2009

July 13, 2009 - SP500 at Critical Point

In the past 2 weeks we've seen some weakness in the S&P500 as it slid below its 50 day moving average, and it's hugging the 200day moving average down!

At the 875 level we have some support as it has been local support and a previous resistance level going back to February.


I am concerned that this support may not hold, as volume keeps declining. I think some big money has come into the market since the March lows, and since these new entrants got in at all time lows, they will be looking to hold through this downturn, if not too severe.

This week is option expiry and more earnings are coming out. Let's see how the week plays out...

Monday, July 6, 2009

July 6, 2009 - SP500 Bearish Head and Shoulder Pattern

This will be a quick update on the S&P500... there is a bearish head & shoulders pattern that has formed here. We tried to take out the 950 level, but were unsuccessful and couldn't come back to retest. The 50 day moving average is broken to the downside and a test of the 200 day moving average, which coincides with the local support level at 880, will tell more of the state of the market.


There are volume and MACD divergences which further indicate the bulls are running out of buying power and the bears are becoming stronger.

Let's begin the trading week....

Friday, July 3, 2009

July 3, 2009 - GOOG Put Spread

Yesterday I saw a trade I wanted to take on Google Inc (GOOG), but I did not want take a position in the stock as it is volatile and requires capital to hold in large quantities. I see support for Google at the 50day moving average, but I do not want to go long the stock as Google is known to move fast and it often gaps up or down before trading hours. So I am making a bullish play using put options, while trying to reduce my negative exposure as much as possible.


I want to give the stock enough room to even move down to its 200 day moving average if needed. In this spread strategy I use put options. I will buy higher strike puts and sell 3 times as many lower strike puts around the 200 day moving average. Let's use a single contract as a base to explain the process better. In this example, the prices for the options are the ones which I got (so they are real numbers).

I bought 1 JULY 360 contract for $1.75/share and sold 3 JULY 350 contracts for $1.00/share. Since each contract represents 100 shares, if the share price stays above $360 by July 17th then, I net $125 based on (300 * $1) - (100 * $1.75). If the share price ends between $350 and $360, then I net the $125 profit plus the difference between $360 and the share price. And if the share price should drop below $350 then I am exposed for losses. The break down is as follows:

Note: Yellow highlights indicate transition levels and Pink highlight indicates breakeven level.
The above calculations are based on a single base (long put) contract.

Premium - recieved up front
Naked PUT Risk - risk assocaited with selling the 350 Puts
Long PUT Value - value of the bought 360 Put
PNL - Profit and Loss is the sum of the above 3 parameters

I realize that Google's earnings are coming out July 16th, a day before the JULY options expire.
But my view remains that even with bad earnings, technically, we should stay above the 200 day moving average at $350.

Thursday, July 2, 2009

July 2, 2009 - HNU update

This is a quick update on HNU.... I am watching it as it fluctuates today and if we finish the day below 5.40 I will close the position and wait on the sidelines.

Tuesday, June 30, 2009

June 30, 2009 - update on HNU

Today HNU dropped on large volume due to an unfavorable report from the EIA stating that "abundant natural gas supplies converge with weak demand driven by an 8-percent decline in industrial sector consumption."


Although I do like Nat Gas as a long-term play and believe that it will do very well when we are out of the recession and well into recovery, I have to keep to my trade rules and technical signals. My stop-out target is below 5.50 and today I came close to getting stopped out.

We have unsuccessfully tested the 50day moving average, and that is bearish. However, counting today's move, we have also re-tested the 5.50 support level 3 times in the past 2 months and stayed above it.

Let's take a closer look with the 2-day chart, broken down in 5 minute intervals:

The 5.50 support line was tested twice during the day but proved to be strong. However, we are not out of the red zone yet.

I have given this trade time to work but it is starting to go flat. I will look to the next trading days for signs of support, otherwise I will close out the position and stay on the sideline and prepare for another approach in the future.

Monday, June 29, 2009

June 29, 2009 - SP500 - Place Your Bets

Well we've had an interesting week. Following the post on June 23rd, bulls lost steam at the 950 level and the S&P500 fell - but to a very strong convergence of the 50day and 200day moving averages. There was support at these levels as we bounced off 890, however, not on the volume that I would have liked to see.


Volume is below average and even though the MACD has ticked up, it is still in a bearish pattern.
Now, let's take a look at a daily chart for SPY, which is the ETF that tracks the S&P500 on a one-to-one (non-leveraged) basis. The chart of SPY clearly shows the same price movements as the S&P500 and the 50day and 200day moving averages converge at the right side of the chart. (click on the chart for a larger view)


At the bottom portion of the chart the Call and Put option volumes are plotted. Notice anything interesting at the right side?
A very distinct spike is visible right before the place of convergence of the averages. A vertical line has been drawn to align the top of the call volume spike with that of the price chart.
At this point a lot of call options are exchanging hands. Buyers of the Calls are betting that the S&P500 will bounce off the averages and the sellers are taking the reverse side. The wheel spins... but who's placing these bets? Which side are the pros taking and which side are the sheep on?

Option volume is another important technical indicators that signals market sentiment and possible shifts. Even though volume alone does not tell us which way the tide will go, it does tell us that the market is taking sides and that there is a tide coming.......

Tuesday, June 23, 2009

June 23, 2009 - SP500 Moment of Truth

On June 13th, I posted the S&P500 Technicals , indicating that the bulls may be running out of steam as the resistance builds around 950 levels. The MACD had also turned bearish.

In the past couple of days we've had some down days, including yesterday which resulted in a 3% drop in the S&P500. The daily percentage drop had not exceeded the 3% line in the recent weeks.


We are at a very important technical point. The 50 day and 200 day moving averages are very important to traders as indicators of resistance or support. And now they have converged at the 900 level, which is also a psychologically significant number.

Yesterday we crossed both moving averages to the downside and closed below 900, while the MACD remained bearish. Today I was looking for some support in the morning, but it was very short-lived and did not produce a significant gain. Movement was in a tight range, but we still closed below the moving averages.

The next few days will be a good indication of the state of the market. If we break the two averages without significant support then we could go a lot lower from here. The next support line may be as low as the 800 levels. If we do see support, I would like to see what happens as we approach 950 again. Resistance seems strong.

Thursday, June 18, 2009

June 20, 2009 - Tricks of the Trade! - part 2

In the last "Tricks of the Trade" post on June 18th, I wrote about how to not get into positions where emotions can become strong enough to affect your decisions. And today's topic also serves to keep you out of emotional trades.

Have a Complete Trade Plan Before You Get In
When you pick a trade with high-probability for profits, pick your entry and exit points at the same time. Remember that you have to pick two exit points. I assume that you would like the trade to be profitable, so first (based on analysis) pick the exit point where you would close the trade and take profits. Secondly, but maybe more importantly, pick your stop-loss point. Pick a point where you imagine the trend you are following to be broken if it is hit. This may be based on support lines, trending lines, or other evidence of a broken trend.

Even if you have determined a zone to execute the exit, pick a price point before you enter the trade. Write it down. If price hits X, I will do Y. This is an important part of your trade plan, and perhaps an overlooked part of trading as a whole. The difficult part after that is actually sticking to your plan once you are in the trade as emotions will run high.

Picking the exact prices before you enter into the trade may not be the greatest idea to an experienced trader as markets are continuously evolving and our trades need to evolve with them, but it will help a newer trader keep out of highly emotional situations, which is the hardest part of trading.

If you don't pick a profit-taking exit, once in the trade, the feelings of GREED will compel you to hold on to the shares in hopes of bigger profits. But as the market turns around and cuts into your profits a new feeling will emerge and take over. This (often very strong) feeling is hope. Hope that "it will go back up!"

If you don't pick a stop-loss exit, once in a bad trade, the feelings of FEAR will dominate. Fear that once you get out of the trade your losses are "real", while if you're still in the trade, the market can come back and make you whole again - financially and emotionally. Here too, feelings of hope have taken over.

I guess it's ironic that hope, a feeling that can be very positive in life, can be disastrous to a trader's account!

Happy Trading.......

June 18, 2009 - Tricks of the Trade! - part 1

This post is dedicated to a trick you may not find in any trading book. It applies to all trading but it is especially meaningful when day-trading.

It's a common saying that you should "put emotions aside" when trading. Well if it was that easy to turn off your emotions then everyone would be making millions. With experience it becomes a little easier to "see through" your emotions to what your ultimate goal is, but you will never be able to trade without those feelings of fear and greed sneaking back into your mind and affecting your trade. What we can do is not put ourselves in situations when strong emotions can be formed.

Don't Consecutively Trade Anything
Let me explain by way of an example. A new trader, let's call him John, will find what he thinks is a good trading setup and puts in the trade. Shortly after the trade goes against him and he is stopped out at a small loss. At this point in time, feelings are created in John. Feelings of loss and disappointment! He will feel especially attached to this stock so he continues to watch it even after he is stopped out.

John believes that the setup was right for the trade and he must have put his stop-loss in the wrong spot. At this point something interesting happens - the stock goes back up as if to continue the trend that John had predicted. Fear of missing the trade is now strong. John is convinced he was right and gets back in the trade, in hopes of making back the money he just lost and then some. He may even increase the size of the trade to get his money back faster - big mistake!

Unfortunately, the markets punish traders the harshest when they are desperate. John watches the trade turn against him again as if there was someone on the other side manipulating the price against his trade. Fearing bigger losses and doubting the trade ever worked, he gets out - now with a loss wider than the original. This creates even deeper feelings which resemble the feeling of trying recklessly to get your money back at the casino table. Nothing can be more dangerous to a trader's account!

It is human nature to feel greed, fear, and hope. We cannot control them, but we can avoid situations where strong emotions cloud our judgment.

I can say that I've been burned many times trading a losing position in hopes of turning it back into profits. As a result, this is now one of my trading rules: Do not consecutively trade any stock. Once you're out of a trade, do not put in a second trade, unless this was exactly part of your original trading plan. Let yourself cool down and the feels to dissipate before you trade that stock again. This often means not trading that stock again for the day.

Happy trading!

Wednesday, June 17, 2009

June 17, 2009 - Quick update on USD (counter-trend trade)

Follow up to the post on June 5th.

The USD.CAD has been a typical counter-trend pattern. In my last post (June 5th) I mentioned that the break in the steep downtrend line has provided a high-probablity potential for quick profits.

The chart below shows the same chart parameters and trendlines as the one posted on June 5th but now more of the trend is revealed as time has passed.


Let's take a closer look with the hourly breakdown:


Some of the support and resistance lines which were drawn on June 5th have held up very well - the local support at 1.0955 has be retested 3 times since.

I have drawn a new trendline to capture the recent move to the upside. It isn't a distinct and confirmed trendline but as a technical analyst it is in my nature to start trying to define new trends...

For those of you still long the USD vs. CAD to capture more profits, remember that this is a counter-trend trade. The general trend is still to the downside. Use smart stops to limit downside moves.

Monday, June 15, 2009

June 15, 2009 - Natural Gas breaks 50day moving average

In the recent weeks the price of Natural Gas has been swinging up and down, testing key support and resistance lines, which is reflected in the price chart of HNU.


After Thursday's test of the 50 day moving average, I expected a key move to define the power of the bears and bulls. Today there was a great move to the upside, breaking the 50 day SMA and most importantly, closing above it, at the top price for the day.


Looking at the 30 minute chart above, we have broken the $6.80 resistance that we saw Friday (June 5th) and again last Thursday (June 11th). We are looking to support a short-term incline that has formed on the short-term.

The only thing that concerns me is the way we are moving, it seems to be in quick burst to the upside, instead of a steady climb which can be sustained far longer. I will look to the rest of the trading week to see if we can keep a steady uptrend. The next resistance level to be tested is the $8 mark.

Disclosure: I own HNU in my portfolio.

Saturday, June 13, 2009

June 13, 2009 - SP500 technicals

The S&P500 has, unbelievably, rallied over 40% since the March lows. This rally which started as a sharp 'V' shape rebound off the low has slowed to a more sustainable uptrend. The line drawn below serves as a loose support line in this uptrend.

There are many people who missed this uptrend and have been waiting for a downtrend to buy-in. The hopes for a much anticipated "buy-in" downturn dissipates everyday as the S&P rallies to new 2009 highs.

Why such a rally? Well, the "this-is-the-end-of-capitalism" fears have subsided and cautious optimism has return to the market, supported by better than expected economic stats. BUT is everything better? Have all the problems gone away? or is this the media at play?!

Let's look at the technical:


If the uptrend line is extended all the way to the right side of the chart, the price is still above it indicating the continuation of the rally. However, there are technical signs that the bulls may be running out of steam here. Looking at the recent price action, the S&P is moving in a very tight range, with lower than average volume - unable to penetrate the 950 level and close above it. The declining trend in MACD while the price traces new highs is a bearish sign, and a technical sign that bulls are losing power at these levels.

However, these are not signs that we're going to crash from here. There are 3 support lines: firstly, the support of trend line at around 925, then the 50day SMA at 911, and the 200day SMA at around 890. The 50day and 200day moving averages are very meaningful to traders, and have to be broken to the downside before another big down wave.

This week is option expiry week, let's see how it goes.....

Thursday, June 11, 2009

June 11, 2009 - HNU is HOT

WOW!!! What a day for HNU. The daily volume once again reached a high, indicating big interest in this ETF. Today's volume was accompanied by a surge in prices. Looking at the daily chart below, the presence of the 50day moving average as a major resistance line is re-enfornced as we failed to close above it, even though it was broken intraday.

However, the fact that we shot up from the drawn support line also re-enforces the 5.50 - 5.80 level as a well tested local support.


As discussed in the first post on HNU, price is getting squeezed between the 50day MA and the support line. Even though there is still no sustained breakout, today's move is a bullish one. Lets take a look at the (30 minute) intraday action over the past 14 days.


The chart above is great evidence of the presence of technical traders in the market that had put their sell orders resting at the top of the recent high.

I am watching this ETF very closely, as like toady, any move will be fast. Tomorrow will be a test for the recent high and the 50day moving average. Watch for false breakouts to the upside. As there are still a lot of sellers in this market, tops will be formed quickly.

I added to my position yesterday at 5.90, and will be looking for a sustained rally above 6.80 to add more. Tomorrow will be interesting......

Disclosure: I own HNU in my portfolio.

Tuesday, June 9, 2009

June 9, 2009 - Don't Ignore Volume

Along with posts analyzing different trends, I will at time post educational or "thought pieces" to my blog. These consist of my thoughts and takes on trading and different trading methods, indicators, and strategies.

Today, I will talk about volume, which is often overlooked as an important indicator of what is happening behind the curtains, masked by the ups and downs of price.

Many times I've heard the increase in volume described as a "more" buyers or sellers in the market. It is very important to keep in mind that the volume describes the number of shares which have changed hands. This means that there were just as many buyers as there were sellers in that day who were willing to change positions at those price levels.

One thing to keep in mind is that an increase - usually compared to an average daily volume - can be an indication of an underlying change.

An increase in volume can result from different scenarios playing out. One could be that "big money" is coming in. This is institutional investors or funds that may be buying in big volume. Although they would try to space out their positions as to not move the market and absorb the sellers, their move will still increase volume. Another reason could be that big traders have flocked to a certain stock or security and they are trading the hell out of it, increasing daily volumes. Either way, there is much focus on this particular stock or commodity.

As an example, lets take a look at the weekly chart of HNU (Ultra shares for Natural Gas):


In this chart, I've separated the volume chart and dropped it to the bottom for more clarity.
At the right side of the chart, a ramp up in volume is clearly visible. Last week the volume sky rocketed to over the 60 million mark when the 3 month average daily volume has been around 4 million shares. This, combined with the stop in downtrend of price signals change.

Below is the daily chart of HNU, which you have seen posted on this blog many times, as I am following it closely.


The daily ramp up in volume is visible in more detail here. This increase in volume does not necessarily mean that the stock will take off from here. There are just as many sellers willing to sell at these prices as there are willing buyers - there is now more of them who are actively changing positions. This indicates a possible shift in market psychology. I've redrawn the support line as evidence has built up that support may not be up trending but more "base building". Let's watch for more developments....

Disclosure: I own HNU in my portfolio.

Monday, June 8, 2009

June 8, 2009 - Why Technical Analysis?

There has always been arguments between the fundamental and technical analysts on which method works. For those who may be new to this:

A fundamental analyst will look to the underlying of the stock, at what the company does, how it makes it money, what are the business risks, et cetera. They can get as deep as coming up with different ratios to compare the "health" of the companies compared to their competitors in order to conclude if the stock is over-valued or under-valued.

A technical analyst on the other hand, does not care about the underlying company and its performance. His trades are based on market psychology - the fact that there are million of people all with the same human emotions of greed and fear buying and selling these stocks. He bases his trades on resistance & support lines, and the different trendlines which may be formed in the process of everyday trading.

Now, why do I prefer technical analysis?
I believe that in the short-term the markets are manipulated on a massive scale. I don't mean in an illegal way, although I'm sure some of that is going on too, but manipulated based on what the media feeds the public. Basically I think the market environment would be MUCH different with the absence of the media, which serves entirely as a massive herding tool for the gullible sheep. With all this information being fed to us through the channels, it is very hard to distinguish what the true fundamentals are. Through loopholes and financial engineering, an ever increasing number of companies are stating misleading numbers and news releases; economic stats are constantly revised; and analysts interpret results to "spin" them in a favorable manner for their firms - there is no trusting these "fundamentals". Not to say that fundamental analysis does not work, it does if you do your own research and analysis and have a long-term horizon, because in the short-term the stock prices do not move according to true underlying values. The stock may continue to go down despite the fact that it is way under-valued and we've seen that in the down turns of January and March 2009.

A technical analyst is like a doctor. When a patient goes in to the office with a problem he tells the doctor what is wrong and maybe guesses at what could have caused the problem. However, the doctor does not base his diagnosis entirely on the patient's word, he runs his own tests like the taking the patient's temperature, blood pressure, or taking blood samples for further testing. The patient may lie or be misinformed but the test will reveal the state of the body. The patient may say he just has a headache, but the tests may point to deeper problems which have yet to surface. In that same way, a technical analyst tries to run tests to figure out the state of the market, irregardless of other data - presented by the company or the media.

For example, months before Enron fell apart, the stock was dwindling lower. There was evidence of massive selling by the people "in the know". However, the executives (who themselves were selling stock), told the public that everything was just fine.

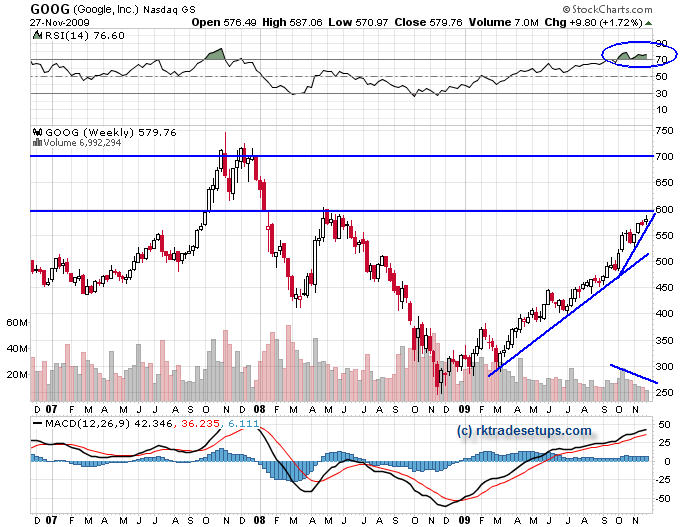
A technical trader tries to "measure" market psychology and "run tests" to find patterns which may suggest which way the security may move. After all, the ultimate goal is making a profit. It doesn't matter what the underlying fundamentals are as long as the security moves in your favor.

June 8, 2009 - Trends in DIG (Ultra OIL and Gas)

I was looking at DIG over the weekend and noticed very distinct technical patterns in the daily chart. Let's take a look at the chart:


On the left side a very obvious head and shoulders pattern is visible. A horizontal line has been drawn to indicate the relative top of this pattern to mark a resistance line for the uptrend forming at the right side of the chart.

Even though the trend has formed a nice channel to the upside, I wonder if it will continue to climb. Here the resistance line at around $32 will serve as a very important mark.

At the bottom of the chart, the MACD traces a bearish pattern - it has formed a higher "hump" at the May 11th top compared to the lower one formed around June 2nd. RSI is not indicating over-bought levels, although it has been above the center line for more than a month.

I own DIG in my portfolio and will look to close the position for profits at these levels if I see signs that resistance will drive the price lower.

Friday, June 5, 2009

June 5, 2009 - quick profits with counter-trend trading

Following the setup I was waiting for and posted on June 2nd, USD.CAD broke the sharp downtrend line and stayed above it for a day.


The long-term chart shows price breaking the down-trend line. Now lets focus on the shorter term chart to see the action better.


When price pushed above the steeper downward trendline, it triggered a watch for entry into a trade. The US Dollar then came back to retest the line, which coincided with the latest high. In this scenario, the previous resistance has become the new support line.

I got in at 1.0975 and sold at 1.1111 for a quick profit. Although I would say that this rise may continue for a longer time period, I did not want to over stay my welcome with a long position in a down trending market. After all this was meant to be a quick counter-trend trade.

If the support level is retested and holds I will look to get in again. For now, I am on the sidelines.