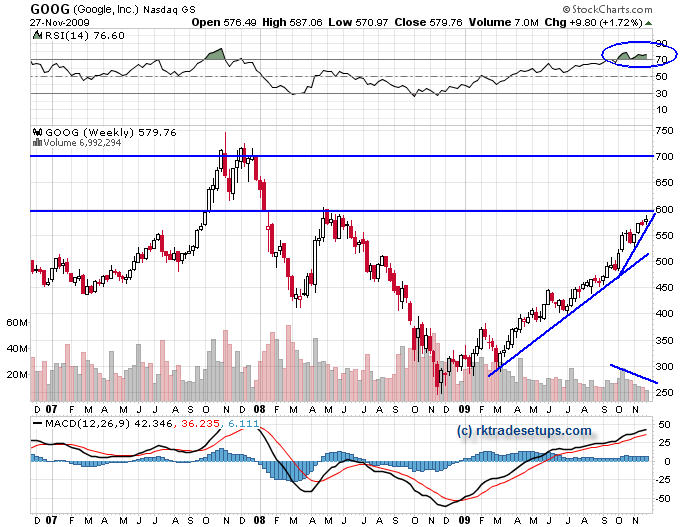
 My counter-trend analysis tells me to watch for a possible break of the recent buying frenzy. Technical signs point to a possible slow down of buyers as volume has steadily declined over the past two months. The RSI is in over-bought position above the 70 line. The MACD is keeping steady and not providing any signals yet, but I would watch for a cross of the faster line over the slower (black line over red).
The daily chart below, shows a more granular detail and possible signals to initiate a short.

I will look to either initiate a short position in the stock or sell near-the-money calls on Google as the trend breaks.
No comments:
Post a Comment