No trade indications in the past couple of days leading to Christmas break with lower volumes and choppier markets....
Merry Christmas everyone.... enjoy the break!!! I'll be back trading with you Jan 16th, 2012.
Sunday, December 25, 2011
Monday, December 19, 2011
Dec 19th - indication areas
There is definitely weakness in the markets, rallies are shorted into, gap ups don't hold.


Friday, December 16, 2011
Dec 16th - single trade indication
Here is the chart, good long indication at a good support level... and the bounce was helped by the news that came in confirming Fitch's AAA rating of France.

Here are the Tweets:
Dec16 12:46- High Probability Bounce Area ES: 1209 Confidence 3/5
Have a great weekend everyone.

Here are the Tweets:
Dec16 12:32- High Probability Bounce Area ES: 1210.5 Confidence 3/5
Dec16 12:45- High Probability Bounce Area ES: 1208.5 Confidence 3/5 Dec16 12:46- High Probability Bounce Area ES: 1209 Confidence 3/5
Have a great weekend everyone.
Thursday, December 15, 2011

Wednesday, December 14, 2011
Dec 14th - weak market
The broad market was really weak these past two days.... most rallies were sold into and support areas were easily broken. I could see a retest of 1200 and maybe lower in the coming days.
Here's today's chart and indications:

Trade safely, capital preservation is key.
Here's today's chart and indications:

Trade safely, capital preservation is key.
Tuesday, December 13, 2011
Dec 13 - not the best day
ahhh damn the Fed and their comments.... throws a wrench into the market everytime Bernanke opens his mouth....
Here is the chart for today:

The one bounce area early in the day was correctly picked, but the system gets caught trying to pick bounce areas in a big wave of selling that comes into the market.... and doesn't do so well.
The massive and disorderly selling makes it hard to average with single contracts, and to remain profitable when the bounce or short-covering begins, a pyramid down scheme needs to be deployed.... so additions to the long positions would have to increase as the market goes down and higher probability areas are established. So for example, long 1 contract in the 1225 range, 2 contracts at 1220, 4 contracts in the 1215 range. This brings the average cost to the 1217.80 area and makes the trade profitable at the bounce.... but it increases risk with every down tick.
More selling than this would mean that at the next level you'd have to buy 8 contracts, and hold 15 contracts!! However, in 99.99% of time there will be a bounce as buyers find lower levels more attractive and as shorts start to cover positions, SO the more you pyramid down, the better that cost average and possibility of profitability in this type of sellers market. HOWEVER, that 0.01% of the time you hit the fat tail and a market condition that is NOT normal in anyway.... just like May 6th, 2010!! This type of day is guaranteed to wipe out your account in a pyramid down scheme! So traders beware!!!!
Trading is a game of probabilities.
Dec 12th indications
Good day today:

Tweets were as follows:
Dec12 10:20- High Probability Bounce Area ES: 1227.5 Confidence 3/5
Dec12 10:22- High Probability Bounce Area ES: 1227.25 Confidence 3/5
Dec12 10:24- High Probability Bounce Area ES: 1226.75 Confidence 3/5
Dec12 10:26- High Probability Bounce Area ES: 1226.75 Confidence 3/5
Dec12 11:48- High Probability Bounce Area ES: 1224.25 Confidence 3/5
Dec12 11:49- High Probability Bounce Area ES: 1224 Confidence 3/5
Dec12 11:54- High Probability Bounce Area ES: 1223 Confidence 3/5
Dec12 11:56- High Probability Bounce Area ES: 1220.75 Confidence 3.5/5
Dec12 11:59- High Probability Bounce Area ES: 1221.75 Confidence 3/5
Friday, December 9, 2011
Dec 9th - System Indicatons
Today's indications came at two time frames indicating a good short area.

Tweets were as follows:
Dec9 11:30- High Probability Drop Area ES: 1247.5 Confidence 3/5
Dec9 11:32- High Probability Drop Area ES: 1247.25 Confidence 3/5
Dec9 11:33- High Probability Drop Area ES: 1247.5 Confidence 3/5
Dec9 11:40- High Probability Drop Area ES: 1248 Confidence 3/5
Dec9 11:43- High Probability Drop Area ES: 1248 Confidence 3/5
Dec9 11:44- High Probability Drop Area ES: 1248.5 Confidence 3/5
Dec9 11:44- High Probability Drop Area ES: 1249.25 Confidence 3.5/5
Dec9 14:49- High Probability Drop Area ES: 1251.75 Confidence 3/5
Dec9 14:52- High Probability Drop Area ES: 1251.5 Confidence 3/5
Dec9 14:53- High Probability Drop Area ES: 1252.25 Confidence 3/5
Dec9 14:55- High Probability Drop Area ES: 1252 Confidence 3/5
Thursday, December 8, 2011
Dec 8th - another day another 12 point capture... and lots of tweets
Today was a great trading day, the volatility was amazing, but the market was generally weak. Not to mention contract rollover day for the ES, so today we started trading the March 2012 contracts as front month.
The long indications are given on the chart below:

The last bounce of the day was very profitable, however the long signals at the end of the day were not traded as bad news came out and there was no time for the trade to work out.
For those following my system signals on twitter @midtownam, probably have noticed that you get multiple indications and sometimes they overlap, this is because sometimes as the ES grinds up and down near a certain level, the system cycles and calls for bounces multiple times at the same level.
So today's tweets were as follows (grouped by time frames):
Dec8 11:10- High Probability Bounce Area ES: 1238.75 Confidence 3/5
Dec8 11:14- High Probability Bounce Area ES: 1238.25 Confidence 3/5
Dec8 11:16- High Probability Bounce Area ES: 1238.5 Confidence 3/5
Dec8 11:37- High Probability Bounce Area ES: 1237 Confidence 3/5
Dec8 11:38- High Probability Bounce Area ES: 1237 Confidence 3/5
Dec8 11:40- High Probability Bounce Area ES: 1235.25 Confidence 3.5/5
Dec8 13:05- High Probability Bounce Area ES: 1234 Confidence 3/5
Dec8 13:05- High Probability Bounce Area ES: 1233 Confidence 3.5/5
Dec8 13:07- High Probability Bounce Area ES: 1232.75 Confidence 3.5/5
Dec8 13:08- High Probability Bounce Area ES: 1233 Confidence 3.5/5
Dec8 13:10- High Probability Bounce Area ES: 1233.25 Confidence 3.5/5
Dec8 13:10- High Probability Bounce Area ES: 1232.75 Confidence 3.5/5
Dec8 13:12- High Probability Bounce Area ES: 1231.5 Confidence 4/5
Dec8 13:12- High Probability Bounce Area ES: 1231.25 Confidence 4/5
Dec8 13:14- High Probability Bounce Area ES: 1232.5 Confidence 3/5
Dec8 13:14- High Probability Bounce Area ES: 1232.5 Confidence 3.5/5
Dec8 13:15- High Probability Bounce Area ES: 1232.25 Confidence 3.5/5
Dec8 13:22- High Probability Bounce Area ES: 1232.5 Confidence 3/5
Dec8 13:24- High Probability Bounce Area ES: 1232 Confidence 3/5
Dec8 14:54- High Probability Bounce Area ES: 1230 Confidence 3/5
Dec8 14:55- High Probability Bounce Area ES: 1230 Confidence 3/5
Dec8 15:49- High Probability Bounce Area ES: 1229 Confidence 3/5
Dec8 15:50- High Probability Bounce Area ES: 1230 Confidence 3/5
Dec8 15:51- High Probability Bounce Area ES: 1228.75 Confidence 3/5
Dec8 15:51- High Probability Bounce Area ES: 1228 Confidence 3.5/5
Dec8 15:52- High Probability Bounce Area ES: 1228 Confidence 3.5/5
Dec8 15:55- High Probability Bounce Area ES: 1227.5 Confidence 3.5/5
Dec8 15:56- High Probability Bounce Area ES: 1225.75 Confidence 4/5
Dec8 15:58- High Probability Bounce Area ES: 1226.5 Confidence 3.5/5
Wednesday, December 7, 2011
Dec 7th - What a kick ass day!
Ok so it's not a common when the system generates a both long and short signal within the same day...... but damn this was a good trade. I've shown the levels on the chart as they happen.

If you're watching the signals come in realtime on Twitter, you'd probably see that for the intraday short signals near the end of the day there were as many as 5 posts.... it is not uncommon for the system to trigger multiple times around a certain area, confirming the possibility of a drop.
If you're not following me on Twitter at @midtownam, then here were the signals:
Intraday bounce signal:
High Probability Bounce Area ES: 1248.0 Confidence 3/5
Intraday drop signal:
High Probability Drop Area ES: 1263 Confidence 3/5
High Probability Drop Area ES: 1263.25 Confidence 3/5
High Probability Drop Area ES: 1265.25 Confidence 3/5
High Probability Drop Area ES: 1264.75 Confidence 3/5
High Probability Drop Area ES: 1265.5 Confidence 3/5
High Probability Drop Area ES: 1266.75 Confidence 3.5/5
Monday, December 5, 2011
Dec 5th, System generated signal & Twitter starts
Today was the first test of the twitter feed for the system generated signals!! The post was made on time and with out problem, EXCEPT that where the ES DEC price should have been tweeted, the word "Price" was!!! Oops!
Still some kinks are being worked out!
The signal came at 3:17pm, when the ES was trading at 1250, which is also a good round number support... there was a 7 point bounce to the end of the day.

Still some kinks are being worked out!
The signal came at 3:17pm, when the ES was trading at 1250, which is also a good round number support... there was a 7 point bounce to the end of the day.

Friday, December 2, 2011

Thursday, December 1, 2011
Dec 1st System indications
Only one signal was given today, which turned out to be an accurate prediction of the exact top.

GREAT NEWS!!
I'm in the process of adding some new features, and one will be the real time indications of my system which will be tweeted at @midtownam. So.... click below:

I'm really excited about this new feature!

GREAT NEWS!!
I'm in the process of adding some new features, and one will be the real time indications of my system which will be tweeted at @midtownam. So.... click below:
I'm really excited about this new feature!
Wednesday, November 30, 2011
Nov 29 and 30th indications
Today the signal produced for possible daily top came within the last 5 minutes of the market close on a very bullish day and were not taken as there wasn't enough time for the trade to work out.
Here is the chart for today Nov 30th,

and this is the chart for Nov 29th,

Here is the chart for today Nov 30th,

and this is the chart for Nov 29th,

Monday, November 28, 2011
Sunday, November 27, 2011

Tuesday, November 22, 2011
Nov 22nd Algo post
Below is the intraday long indications given by the algorithm for today Nov 22nd:

and yesterday Nov 21st,


and yesterday Nov 21st,

Friday, November 18, 2011
Nov 18th Algo Trades
Market choppiness has started to persist..... the push and pull between the bulls and bears can clearly be felt in the markets, and this puts many longer-term traders on the sidelines as they await some kind of trend to establish.

Anyways, today there is was a single indication from the algorithm to go long. It came at 1213.75 in the early hours.

Thursday, November 17, 2011
Today's Algo results
What a blood bath day.... the algo picked mostly bottoms of the days today, although it was a down day.... it showed sensitivity to the 10:35am top to call for top of day, but did not trigger a signal! Here are the long triggers for today:

As you can see signals work best with already established support and resistance areas.

As you can see signals work best with already established support and resistance areas.
Wednesday, November 16, 2011
RK Algo results
Here are today and yesterday's algo top and bottom picking indications.
You can see that the tops were picked almost perfectly, the bottom was picked after 3:30pm which is too close to the close to be taken as a trade because the market doesn't get enough time to play out the trade.
Today Nov 16th,

Nov 15th,

You can see that the tops were picked almost perfectly, the bottom was picked after 3:30pm which is too close to the close to be taken as a trade because the market doesn't get enough time to play out the trade.
Today Nov 16th,

Nov 15th,

Tuesday, November 15, 2011
An Indicator to Rule Them All
Finally after a lot of research, back testing, and some strenuous programming, I've drawn up the first version of this new market indicator... and I haven't given it a name yet..... suggestions are welcome haha
I don't think I'll ever consider any indicator, algorithm, or strategy complete, and will continue to evolve it make it better..... but for now I consider it workable.
Now a little background... this algorithm developed completely by accident when I was trying to figure out ways to analyse real-time tick data of all underlying S&P500 stocks so I could develop a long/short strategy involving all the 500 stocks.
This algo, originally meant for another purpose, started to pin point market tops and bottoms intraday which were tradable on the ES Futures. Sometimes it is so damn accurate at picking market tops and bottoms intraday that it's scary. BUT as I learned long ago in physics class, there are always times when a rule breaks down. For this algo, it happens to be market disruptions, for example huge news that hits the market during the day which causes most traders and more importantly computer algorithms which usually trade different strategies against each other to align and take the market in one direction without giving it a chance for correction. So as you may have already guessed, this is a counter-trend algorithm as it tries to pick an intraday market bottom or top before it actually happens.
So until I decide against it, I will put up my daily ES charts with markets at times of indication, exactly when they are given. Although I will be posting the charts after the day is over, I will NOT move or put in the indications after the fact.... they will be put in while I'm making trades, in real-time.
Also note that, the algorithm comes up with different "likelihoods" of reversal when it gives the signals, this will not yet be put on the charts. So you will only see the indications, but not the confidence level yet.
Below is the Nov 9th indications on the 1 Minute ES chart.

and Nov 10th,

Also, you will notice some trend lines and support and resistance lines are drawn during the day, as well as green up triangles and yellow down triangles... which is another one of my programmed indicators.
It is worth mentioning that there are days when NO indications are given, and I will probably not post these days' charts.... otherwise I'll try to keep posting the results here on this blog.... STAY TUNED FOR MORE.
Wednesday, October 26, 2011
Trading is a zero-sum game? Bullshit!!!
Have you ever heard this before? "Trading is a zero-sum game!"
This is a statement that is in most beginner "learn how to trade" books, and its bogus! If you haven't heard it, the basic premise, is that for every buyer that takes a trade there is a seller, and vise versa..... so when you make a trade someone is taking the other side of it, so in every trade there is a winner and a loser. The winner being the person who called the right direction, and bought when prices moved up, and the loser of this would be the guy who sold to him.... this implies that you are only buying and selling from one person!!!
The intention of the statement is to think that if you're buying and someone is willing to sell to you, then what is it that the other person knows that you don't know.... and what if the person taking the other side of your trade is a trader at a bank who obviously has access to better and faster info than you sitting at home and putting on a trade through the internet. And why is it that you think you're out smarting the other person who obviously just took the opposite side of your trade!!!!
The statement makes sense to a beginner trader, because it seems logical, if I buy then someone else is selling to me.... so he must be taking the OPPOSITE side of my trade... and if I WIN, then he must LOSE!
This idea is NOT true.... someone IS taking the opposite side of your trade, but only at that moment. Think about it like this.... Google (GOOG) IPOs at $100 and starts trading, and for simplicity assume that there are NO short sellers, you can either buy new shares or sell your already existing shares. Buyers come in and bid $100.50/share, the sellers are the founders of Google, bankers who own shares as part of the IPO and other similar parties..... if they are satisfied with $100.50/shr then they will sell to the buyer. Now the price of GOOG is $101.50... now comes along another buyer who is willing to buy at $101/shr because he thinks GOOG will go to $120 and bids $101.00/shr, now if the founders OR the guy who bought at $100.50/shr want to sell at a higher price they can do so because there is a buyer..... And so on the price moves up.
Look at the transactions above, THERE ARE NO LOSERS!! Everyone has made money and the guy who bought at $101.00/shr is neutral on his position. So even though trades were made, there were NO losers!!!
The person who took the other side of your trade wasn't a banker with more info who KNEW you were being suckered at $100.50, but perhaps a founder who wanted to sell out of his shares fast.... yet he still made money!
Now you're saying well prices can't go up forever, so there has to be a loser..... well you're right! Let's say that through many trades the price of GOOG was bid up to $400, where someone just bought some shares at $400, but some unfavorable news came out and people who owned shares got scared, now there are no bids above $400, but there is someone who would buy GOOG at $395, so one of the founders sells to this bidder for $395/shr....... now the price is $395/shr. Even here everyone who has bought below $395/shr has been a winner and continues to be a winner, but everyone who bought higher than $395/shr has now instantly become a loser!! BUT this is only a select group of late buyers!
So the statement that trading is a zero-sum game and that for every winner there is a loser who took the opposite trade is BOGUS!!! Do NOT think of trading in that way! Many buyers and sellers come to the market , some are buying for the long-term, and some buying for the short-term... some are selling out of their positions while others are buying their shares, anticipating more future upside... and so goes the market!
Wednesday, September 28, 2011
Price movements explained
Well it's been a long while since I've posted to this blog, but I've been learning incredible amounts since starting to trade full-time and I want to share some of them with you.
The financial markets are a complex machine, a collection of Billions of buyer and sellers of a wide variety of financial instruments.... stocks, futures, bonds, forex, derivatives and other structured products.
Most beginner traders look at individual stocks which are usually the well known and talked about stocks like RIMM, GOOG, AAPL, GM, DB, etc. and they try to trade single stocks and pick winners or time the long and short positions in each of these stocks just by looking at their charts. BUT they don't see or grasp relations in the financial markets yet and they get frustrated about why that stock didn't go their way.
Let me give you a broader view, investors bring money to invest, the collection of all the money in the world is limited. Even though this isn't completely true, it helps if you think of all the money in the world as a constant amount. Now all this money wants to be invested for the MAXIMUM return with MINIMUM risk at every second of every trading day! For this to happen the money has to MOVE from one place to another, and from one instrument to another. Also at any one time, certain financial products are more favorable and promise better returns than other, or perhaps more safety than others.
For example, let's say investors own bonds in Alcoa which pays 6% interest, now all of a sudden Alcoa offers another set of bonds with the exact same characteristics as the first, except it pays 10% interest.... wouldn't you expect the savvy investor to sell his 6% bonds and come buy the 10% bonds? ... So the price of the 6% bonds goes down as demand goes down, and the price on the 10% bonds go up as demand goes up.
The world financial markets work exactly the same, total invested money stays the same, but it gets moved to what is perceived to be MORE favorable. So recently you've seen US stocks go down while everyday treasuries go up. Investors are seeing stocks as risky and treasuries as safe... so money comes out of one and goes into the other and it drives their prices respectively.
Now take one step back beyond the US markets and look at it globally... there are millions of other investors in the world they want to put their money in the best place. But what if all of a sudden US is thought of to be near bankruptcy?? Now it's not safe for anyone's money. So global investment money would come out of the US as a whole and go somewhere else, maybe for example Asian Stock Markets! So now US stocks AND treasuries fall as demand for ALL products go down.
So the single US stocks that you may be looking are a molecule in universe of global financial markets. Although important, greater forces are at work when it comes to if that stock will move up or down. So no matter how great of a company Google or Apple is, when money is in rotation and it rotates out of stocks, or out of the US markets in general they will go down.
There are millions of factors which dictate where money will go, but let's look at one example, if US Dollars become cheap relative to global currencies, then buying US investments becomes cheaper for the global money. The European fund that was looking to buy the S&P500, for 1 Billion Euros can now buy MORE of those shares because his 1 Billion Euros buys more US Dollars now.... so US markets are little more attractive now! So exchange rates too have an impact on the markets and the stocks you select.
Although this was a very brief description, it gives you an idea of how everything is interconnected and when deciding what to buy or sell, you have really take a step back and see the whole picture... because these forces are the MAIN forces driving markets and you should not bet against them!
Monday, August 8, 2011
What a day!!!
Downgrade of the US credit to AA+ from the coveted AAA had a devestating impact on the market. Check out the market breadth.


Where the vertical axis is the number of S&P500 stocks who's one day return (vs. yesterday's close) is plotted on the horizontal axis. The distribution is incredibly negative!!!
Sunday, May 1, 2011
Quant Trading
I've recently read a book on quantitative trading, appropriately named "Quantitative Trading" by Ernie Chan. This is great book for those with some prior knowledge of math based trading, and Matlab.
It discusses in detail the two main trading strategies: 1) Trend-based algorithms, which try to find and trade in the direction of the trade, and 2) Mean-reverting strategies, which basically says that all securities (stocks, futures, forex) will eventually return to a mean value.... basically this is the good old "What goes up must come down" theory!
The two strategies are somewhat opposing, and Ernie even discusses a mathematical way of defining a market in trend vs. a market good to trade for mean-reverting strategies.
I have also been reading his blog epchan.blogspot.com, which I would recommend highly to traders interested in quantitative methods of trading.
I know I haven't posted in a while on trading topics, but I've been really busy studying for the Level 2 CFA exam coming up in June.... I promise more posts to come after my exam.
Happy Trading!
Monday, March 7, 2011
Why technical trading vs. value investing
ahhhh yes... the big question.... why trade based on moving averages, support & resistance levels, and patterns versus good old stock picking based on good balance sheets and strong cashflows?? This is an age old question and battle of the two camps.
I can't answer for everyone, but I can share my point of view.
Value investing is based on using financial metrics of a company, like cashflow ratios, leverage ratios, and stuff like quality of management. Plug numbers into a stock growth and valuation model and you should get the "value" of the company. If the value is higher than what the stock is trading for, then buy it, you are now a value investor. So if based on your model AAPL is "valued" at $400/share and trading at $350/share, you should buy it. And eventually the market will realize its value and it will trade up to where you thought its value should be!
But what about in between? What if it goes to $300 in the meanwhile? And how long will it take for the market to realize that maybe AAPL is a greater "value" than $350 and start trading it up? This is the reason why value investors give themselves such a long investment time - Warren Buffers' is Forever!
Value investing is based on trusting the company's numbers and trusting that they are not using any kind of financial manipulation to artificially show income or growth, but this happens more often than you think.... and legally too. And when they take this financial trickery too far they may get caught by the SEC, but this is too late.... by the time you hear about it, the stock has already plunged. The most notorious case is the famous trickeries of ENRON!
My last post was recommending the book [Swindlers] Cons & Cheats and How to Protect Your Investment From Them which talks more about this.
So companies' numbers are hard to trust, and I've already discussed in my previous posts how equity analysts are actually working against the public interest..... add to this the manipulation going on by other big market participants and high frequency trading algorithms and you have a market unfit for INVESTING.
Now trading based on technicals is meant to be shorter term, and actually based on signals from the market, based on demand and supply at each price level. I can give you a simple example for how I see the difference between them:
A person with a major migraine goes to the doctor to be cured, the doctor asks questions like: what are your other symptoms? What did you have to eat? Did you take drugs? Now the patient may tell the truth about the first two, but hide the fact that he just done enough coke to put down an elephant. The doctor has incomplete information, or even wrong information to treat the person. But then the doctor takes some blood and measures the heart rate. Now the heart rate is high and the blood test shows possible drugs in the system. The doctor can make a decision based on facts, not statements.
In this example, the patient lies, but the facts state with a high probability (notice I didn't say definitely), what may be wrong with the person. Similarly, when traders go in and out of the market, they leave footprints revealed in technical analysis. (More on this later)
Technical trading is based on reading these different clues as to what may be going on with a stock or the market in general..... learn to read technicals even if you are a value investor.
Saturday, February 26, 2011
Swindlers
I recently finished reading a book about swindlers and con artists, but not in the way that you might think. This book talks about how the financial auditors and corporate management basically have their hand in the same pie, and the ultimate price is paid by the simple, average investor.
This is the book, and I highly recommend it:
Although this book focuses on the vulnerability of the Canadian Market, I think it's a good general read for anyone who wants to know more about the different schemes in the market, for example, there are example of different kinds of Ponzi schemes, financial trickery and other methods used by corporate executives to get paid at the expense of the average investor.
Swindlers talks a bit about how the Canadian market has become a great place for these scams because of the lack of prosecuting power as well as non-conflicted regulating bodies. There is some focus on how the public mining companies listed in Canada exploit the loop holes for their benefit.
I would say that the book reads kinda boring at times, with repeating evidence of how the introduction of the International Financial Reporting Standards (IFRS) is going to allow more loopholes into the system. But there are some very valid points that I don't think I would have read anywhere else.... the media certainly doesn't talk about this stuff!!
Wednesday, February 9, 2011
Why equity analysts are Wallstreet goons!
First off, my apologies to my equity analyst friends... This is not personal, it's business!
You know these guys when you hear a headliner on CNBC or Bloomberg, like "Goldman Sachs downgrades RIMM from Buy to Hold", or "Morgan Stanley upgrades Google from underweight to neutral." Now, where's the conflict?
1. We believe these analysts have a duty to report a fair analysis to the public and investors. (fair is by itself vague)
2. These analysts work for banks and these banks own positions in stocks.
3. Banks pay the analysts' salaries and bonuses, not the public!
Who do they work for? Whose interests would they be likely to protect?
So, when an analyst upgrades a stock, don't put in a market order and blindly buy it! Same goes for a downgrade, don't just sell it! What's happening here is actually counter intuitive. The banks aren't in the business of making money for the public, they make money for themselves! And they do make it, at the average investors' expense.
Just as an example, On Oct 28, 2010 Oppenheimer downgrades RIMM from Outperform to Perform, and on Nov 30, 2010 Jefferies, upgrades RIMM from Hold to Buy! Two firms, with essentially similar valuation models for stocks see the need to go opposite ways on the outlook for RIMM. (I'm simplifying, there's more that goes into it.)
Now what's the point of all this? Remember my post from a couple weeks ago on why stocks go up or down? Here's the link (Why Do Stocks Go Up). Read it to understand this situation better!
This basically says that there are only a certain number of buyers or sellers in the market at certain prices, so big volume selling from someone will drop the price because there aren't enough buyers (at the current prices) in the market. Now let's say that Goldman Sachs has big a position in RIMM, (and I don't mean 1000 shares, I mean 500,000 shares or more) and they feel that the medium-term future is not so good.... and they don't wanna be left holding the bag when the bad news hits... SO, the analyst steps in with an upgrade based on some bullshit qualitative reason that no one will remember a week from then. The news of the upgrade hits Bloomberg TV, CNBC, and other news wires. The average investor looks at this as a positive sign and decides to get in.... Call broker, or login to online account, hit BUY RIMM @ MARKET.... after all if Goldman thinks it's good, why would it not do well. So a sea of these buy orders come into the market and the traders at Goldman will sell into it without tanking the price of the stock in the process!
So the upgrade facilities the selling that Goldman will do, they will essentially sell what they don't want anymore to the average public!!! For me learning this was like I was learning that I live in the Matrix and the world is not what we believe it to be!
Don't listen to analysts!
Tuesday, February 8, 2011
Buyside vs. Sellside
I heard an interesting line today.... wanted to share it.
What's the difference between buy-side and sell-side?
The buy-side guy yells "Fuck you" then hangs up the phone, but the sell-side guy hangs up the phone then yells "Fuck you!"
Wednesday, February 2, 2011
Who's looking at my blog?
In the spirit of transparency and openness, this is the monthly stats for "RK Trade Setups" for the month of January 2011.


Tuesday, February 1, 2011
Why I buy-and-sell, not buy-and-hold
I've recently found myself more attracted to the high-frequency-trading style, because the trades are ultra short-term, and almost have absolutely nothing to do with the underlying stock or what the "analysts" think of it... (you can totally tell I'm still scarred by the BIDU analyst burn)!!
In every investing book, I read how over the long-term investing in indices is better and blah blah blah, but when I put the book down and look at the reality of what's happened in the past 10 years I see pain, I see ruin, ruin of people's spirits and their accounts. WHY? Because of emotions!
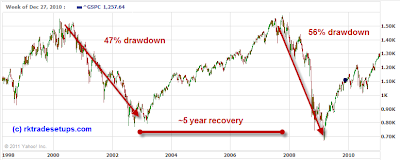
Sure, it all sounds great to make an average of 10% a year by holding an index of S&P500 stocks from 1950 to 2010, BUT life doesn't work like that. The texts that preach this style, don't usually talk about drawdown, they don't talk about the pain that the average investor will endure while the market finally stops dropping and enters a bull market again. By my own calculations, using publicly available data (Yahoo Finance), if you invested on Jan 1, 1950 and until Feb 1, 2011, you would have made an annual compound return of ......... 7.4%!!!!! Not to mention watching your portfolio go through some major drops, two of which would have been in the past decade! In the 1999 crash, you would witness a 47% drawdown (peak-to-valley), and a much more violent drawdown of 56% in the recent 2008 crash, which we still haven't recovered from!
Did everyone hold their portfolios through this downturn? Or did people sell at the worst time because emotions took over?

Did everyone hold their portfolios through this downturn? Or did people sell at the worst time because emotions took over?
Ultimately it comes down to preference and trading style, for me short-term is the way to go!
Wednesday, January 26, 2011
Level II Quotes
Below is an example of simple quotes which are often associated with stock quotations. The bid is what someone is willing to buy the stock at and the ask is what someone is offering to sell their stock at... the difference between them is called a bid-ask spread. The Last column indicates the last price agreement, where stocks were traded, and volume is how many shares have been traded so far.

There are also the bid size and ask size which shows the number of shares (in 100s) at the price shown.... so here the highest price someone is willing to pay for GOOG at the moment is
$617.01 and they have 100 shares to sell. Similarly, someone else (or a collection of people) are willing to buy at $618, there are 200 shares willing to be traded at that price.
The quotes are similar to the car example from yesterday's post, however, here you only see the best prices, but not really what others are willing to pay or offer..... so you don't know who else is buying or selling cars - how many or how much. Below is a Level II quote monitor:

The left column is the bid, the right is the ask. These are all a list of people waiting to buy or sell their stocks at specific prices. You can click on the image to enlarge and see the text better.
So you can see in the bid column, there is someone waiting to buy 100 shares at $617, BUT the next one after that is at $616.58, and someone or collection of people waiting to buy 1100 shares at $616.50. Similarly in the ask side.
This information is very helpful and in a way gives you an in-depth look at what's driving the market... basically a look at supply and demand info!! You can see that all it takes is for someone to be willing to sell 400 shares of GOOG at market for the price to reach $616.55 from the current $617.50 last traded price!! Ever heard of anyone saying that big players can move the market with their orders? That's what it means - if someone all of a sudden dumped a large number of shares, it could drive the price of the stock down, same is true for driving the price up with market buy orders.
BTW, Level II quotes are not free and brokerages usually charge a monthly fee for allowing access to this data.
Why do stocks go up?
Seems like a pretty simple question doesn't it?
It's one of those questions that you hear and figure you know the answer to, but take a moment and try to answer it.... why did Google just go from $640.31 to $641.25 in 3 seconds? Has the value of the company and its products changed somehow in that time period? ..... What's making it move higher?
To the question "why do stock prices rise?" most people answer, "because there are more buyers than sellers so the price goes up!" Well this isn't quite right, there are no more buyers than there are sellers, you need one buyer and one seller to make a transaction, so someone just bought Google at $640.75 and someone else sold it exactly that same price.
To completely understand this, you have to grasp the idea that the stock market is an auction system of buyers (bidding) and sellers (asking) for prices.... hence the bid and ask.
To get a better idea, I will use an analogy I recently read in a book. Let's say you put your BMW up for sale at $50,000, someone comes in and offers you $45,000 for it. You now have a market, a buyer and a seller, but no transaction is taking place because nobody has agreed on a price. You bring down the price to $48,000 and the buyer agrees... now a trade has taken place and the "Last" known price on that BMW is $48,000.... this is how "Last" or "Latest Trade" prices are posted on stocks.
Now, let's expand this. You put the BMW for sale at $50,000, and someone else has put a similar one for sale at $51,000 and someone else at $52,200. The same buyer wants to buy at $45,000. BUT now a hedgefund guy wants to buy his top two sales guys BMWs (which are similar... you know, to avoid jealousy)... he looks into the market and sees three are for sale. He doesn't have time to haggle over a silly couple of thousand dollars, he wants the cars NOW! So, he buys the lower priced $50,000 one, but he still needs another, and there are no more for sale at $50k!! Since he wants the same cars and he wants them now he goes to the other seller and buys the other BMW for $51k. Now the "last" price or "latest traded" price on that specific BMW is $51,000. Market prices went up!
Stocks are the same, there are sellers at certain prices, and they only have a certain number of shares to sell. So more buyers don't necessarily bring up prices, but buyers who want the stock NOW do! They buy the lowest priced stock, when there are no more sellers willing to sell at that price there will be sellers willing to sell at higher prices... if the buyers are willing to pay a little more they buy the shares from the higher sellers too and the price of the stock rises!!
The next post will show more of this with Level II quotes....
Monday, January 17, 2011
Talking kills....... your portfolio!
Even though I'm starting to post to the blog again.... this time around some things are gonna be different!! The main thing is that I will no longer post my trades on the blog... and I will tell you my reasoning for this.
Since the last post and the loss of the BIDU trade, I' ve done much self reflection and analysis of the trade. Since then I've read many books on behavioral finance which although seems to be a buzz-word these days, is a very interesting topic on which I will post more details later.
The focus of behavioral investing/finance is that we're all human and as humans our brains work a certain way.... a sort of "snakes = danger" kind of behavioral pre-programming, if you will. The point is that some of these pre-programmed behaviors is actually counter intuitive and work against you in the world of today and especially in the world of investments and trading.
One main topic of behavioral finance is the confirmation bias. This is when you have bought a stock based on whatever reason you had... good or bad! Once you have a position in it you are inclined to talk about it. The more you talk about it, the more you convince yourself of your reasons, and the more emotionally attached you get to it.
For example, a typical convo could go like this:
I ask,"so what are you holding these days?"You: "I just went long RIMM!"Me: "I don't know, the market keeps beating it down."You: "I've done my research, it's undervalued, it has great products, everyone has a Blackberry and the PlayBook is gonna blow iPad outta the water!"
This seems like a pretty harmless convo right? WRONG!!!
You may not think about it, but your mind has just attached a bit of emotional value to this particular investment/trade!! More that justifying it to your friend, you have justified it to yourself... and this is the most dangerous thing to do.
Through more conversations you will attach more emotional value to it and it becomes that much harder to sell if you're wrong about the decision and its time to cut your losses and move on... because you now deeply believe your decision was right, why else would you explain it to everyone?!... selling at a loss becomes a hit to your self-esteem and we as humans will do anything to avoid that.... including holding a trade way past the place where you KNOW you shouldn't be holding.
So this is now one of my trading rules.... "Never discuss open positions"...
This way when it comes down to selling, my mind is clear and unattached from the position. My advice to every trader out there is to avoid telling friends, family, or anyone for that matter about open positions and reasons for your trade.
More on this interesting topic later...
Saturday, January 15, 2011
I'm back, a little scarred and a little wiser
I recently read a stat that there are currently 20 million inactive blogs on the internet, which someone has started and somewhere along the line didn't bother to continue to post to. Now I don't know where that number comes from, but the idea of starting a blog and giving up on it somehow gave me the feeling of admitting defeat and that is certainly NOT my intention.
If anything I have learned much from this huge drawdown and as a result want to put the lessons learned out there so that others can avoid it......... although as a word of warning, I must say that I've read many books, blogs, and trader strategies and they all warn to cut losses immediately and before they become big, so reading may not do any good.... the best way to learn is to experience it and let it leave a scar - that way you never forget.
For all who followed by blog until June of 2010, know that I used to post all my trades as well as the occasional educational piece on trading. I made a trade in June and shorted many contracts of BIDU Call options and this spelled disaster for my account. I did not cut my losses and it grew.... and fast!!! It took me a while to sort it all out and for all to see I will post my trading account equity line for 2010, measured monthly.

The losses from the BIDU trade put a huge damper on my account, and at its peak caused a 32% drawdown.... which was unacceptable because it was caused by a single trade.
After I closed the trade at an enormous loss and with much psychological pains I stopped trading for 3 months until I sorted through the emotions. Afterwards I came back to the table with a clear mind and started to build my account up again.... and by October of 2010 the account was profitable again and it ended the year with a 7% annual gain.
In my next posts I will talk more about the process and the lessons learned.... There will be some changes to the style of the blog, BUT I am back and will be posting again so stay tuned.
Subscribe to:
Posts (Atom)